The best country to live in – Part II
In my last post, I presented some graphs to see in which country a person would be lucky to be born.
I used data from two indexes, the HDI and the Gini. There are other indexes we could follow, but the one which I find more interesting is the Happy Planet Index. According to their webpage:
The HPI measures what matters: the extent to which countries deliver long, happy, sustainable lives for the people that live in them. The Index uses global data on life expectancy, experienced well-being and Ecological Footprint to calculate this.
Let’s see the classification according to that:
Top ten countries
| Costa Rica | 64.0 |
| Vietnam | 60.4 |
| Colombia | 59.8 |
| Belize | 59.3 |
| El Salvador | 58.9 |
| Jamaica | 58.5 |
| Panama | 57.8 |
| Nicaragua | 57.1 |
| Venezuela | 56.9 |
| Guatemala | 56.9 |
Bottom ten countries
| South Africa | 28.2 |
| Kuwait | 27.1 |
| Niger | 26.8 |
| Mongolia | 26.8 |
| Bahrain | 26.6 |
| Mali | 26.0 |
| Central African Republic | 25.3 |
| Qatar | 25.2 |
| Chad | 24.7 |
| Botswana | 22.6 |
USA would be number 105; Denmark, number 111; Australia, 76; Sweden, 52 ; United Kingdom, 41; and my country, Spain, number 62. The first two developed countries are New Zealand and Norway, in positions 29 and 30.
How is that possible? The answer is the Ecological Footprint.
The EF is a per capita measure of the amount of land required to sustain a country’s consumption patterns, measured in terms of global hectares (g ha) which represent a hectare of land with average productive biocapacity.
In other words, and simplifying, if you use industrial products your EF is bigger than if you don’t, which penalises developed countries.
After all, the P in HPI stands for Planet, not People. I’m more interested in people, though, so today I’m trying to set my own Presbiter Iohannes Real Welfare Index or PIRWI, which sounds funny.
What should be important to measure welfare?
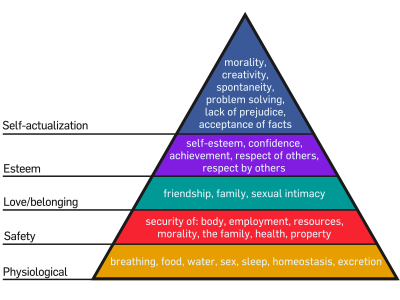
This is the Maslow Pyramid:
The more levels of needs you have eased just by being born in a country, the better odds you have to be able to have a fulfilled life.
The most important aspects to consider are:
- Development. In my opinion, it is obvious that the more developed a country is, the better a person can live because development assures better medical attention, better alimentation, better education and a higher life expectancy. So I’ll take the HDI, which measures all of these.
- Experienced well-being is very important too, so I will use this factor from the HPI and will discard the EF, as well as the life expectancy, because it would be redundant.
- Large social inequality should be avoided to have a peaceful society. Thus, the Gini coefficient would be useful.
So far, with these ingredients, we could make a good PIRWI, but there are some factors that I have left aside, such as:
- Crime and Corruption Perception indexes. You can get used to it, but that doesn’t make it right.
- Suicide rate, obviously.
- Net migration rate. If everybody wants to get out, it can’t be a nice place. It also works the other way around.
- Social and economic freedom. The Freedom Index provides the measurement of this point as well as number 4. You can find a larger explanation in the sources.
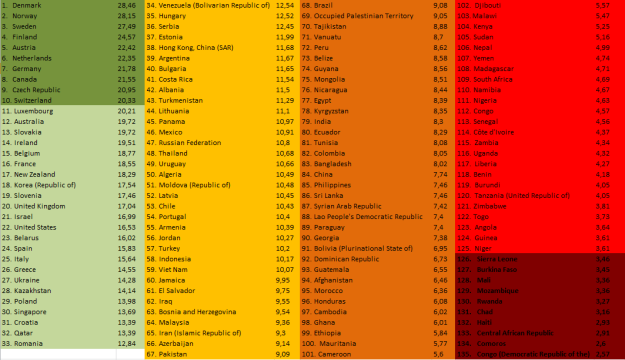
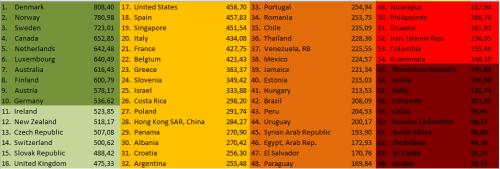
Problem is that not all the countries have statistical data regarding these aspects, so their use shortens the list quite a lot. That´s the reason why I have created a second index: the PIRWIF or Presbiter Iohannes Real Welfare Index of Freedom. You will notice some differences in the rankings.
At the end of this post you can find the sources, the formulas and their explanation, if you’re interested, but now, without further delay…
The PIRWI
And the PIRWIF
And that would be it. Any thoughts?
Nota bene:
The formula for the PIRWI is simple:
The HDI from United Nations times the Experienced Well Being from the Happy Planet Index (both positive aspects) divided by the Gini coefficient (negative), which is higher when the country has more inequality, that is to say, when the income differences in a society are bigger (rich people are richer and poor people, poorer)
The formula for the PIRWIF is a little trickier:
In every data I took the last available one and sometimes they are from different years.
The Freedom Index (quite thorough) structure is as follows:
I. Security and safety
A. Government’s threat to a person
1. Extrajudicial killings
2. Torture
3. Political imprisonment
4. Disappearances
B. Society’s threat to a person
1. Intensity of violent conflicts
2. Level of organised conflict (internal)
3. Female genital mutilation
4. Son preference
5. Homicide
6. Human trafficking
7. Sexual violence
8. Assault
9. Level of perceived criminality
C. Threat to private property
1. Theft
2. Burglary
3. Inheritance
D. Threat to foreigners
II. Movement
A. Forcibly displaced populations
B. Freedom of foreign movement
C. Freedom of domestic movement
D. Women’s freedom of movement
III. Expression
A. Press killings
B. Freedom of speech
C. Laws and regulations that influence media content
D. Political pressures and controls on media content
E. Dress code in public
IV. Relationship freedoms
A. Freedom of assembly and association
B. Parental authority
C. Government restrictions on religion
D. Social hostility toward religion
E. Male-to-male relationships
F. Female-to-female relationships
G. Age of consent for homosexual couples
H. Adoption by homosexuals
Sources:
http://en.wikipedia.org/wiki/Human_Development_Index
http://en.wikipedia.org/wiki/Gini_coefficient
http://www.happyplanetindex.org/
http://www.fraserinstitute.org/research-news/display.aspx?id=19170
http://en.wikipedia.org/wiki/Suicide_rate
http://en.wikipedia.org/wiki/List_of_countries_by_net_migration_rate
http://en.wikipedia.org/wiki/Maslow_pyramid


