
The strange case of Spanish unemployment
by presbiter iohannes
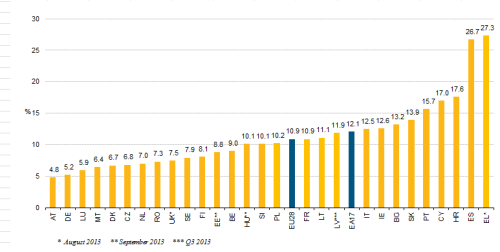
Take a look at this:


In Spain, almost three people out of ten willing to work are unemployed. Picture that:

As you read this, the unemployment rate in Spain is 26 %. If you think that’s incredible, wait for the figure for people under 25, it’s 54.4 %!

How on Earth is that possible? I mean, we are talking about a country in the EU, in which the mean rate is the 10.9 %, only Greece’s (and recently) is higher, and its HDI is the 23rd in the world, way better than other countries with lower unemployment rates.
Lets’ read what some experts have to say about this issue.
Samuel Bentolila, Pierre Cahuc, Juan Dolado, Thomas Le Barbanchon (three professors and a PhD student) in this article, compare French and Spanish unemployment rates and say:
Behind their apparently similar employment protection legislation (EPL) we detect two main differences often ignored in cross-country comparisons:
- Spain has a larger gap between the firing costs of workers with permanent and temporary contracts, and
- a much laxer regulation on the use of temporary contracts.
According to the widely used OECD (2004) index of the strictness of EPL, which ranges from 0 to 6, the overall EPL score is 3.0 for France and 3.1 for Spain (where the US has the lowest value, 0.7, and Portugal and Turkey the highest, 4.3). Hence, Spain appears only slightly more regulated than France. However, there are good reasons to think that this average EPL index, based on legal regulations and not on their implementation, does not capture Spanish EPL satisfactorily. Indeed, de facto EPL of temporary jobs is much weaker in Spain than in France, whereas the opposite holds for EPL of permanent jobs.
Considering only red-tape firing costs generated by third agents, such as labour courts and labour authorities, which cannot be compensated for in wage bargaining (since they are not a transfer from the firm to the worker), we find that the gap between both types of contracts is 50% higher gap in Spain than in France.

The causes, according to them, are:
- Much higher firing costs for permanent contracts than for temporary ones.
- Easiness for temporary contracts.
- The loss of jobs due to the bursting of the housing bubble.
I decided to check that out and searched for information in the statistics portals of the OECD the UN, Eurostat and World Bank. The countries represented in the graphics as blue diamonds are: Austria, Belgium, Czech Republic, Denmark, Estonia, Finland, France, Germany, Greece, Hungary, Iceland, Ireland, Italy, Luxembourg, Netherlands, Norway, Poland, Portugal, Slovak Republic, Slovenia, Spain, Sweden, Switzerland and the United Kingdom. All the data are from 2010, 2011 and 2012 (more explanations at the end of the post). I’m just a dilettante, not an economist, and perhaps I will misuse some statistics, even if I try to do my best, but regardless of that, I think you will draw your own conclusions.
First of all, let’s see how the index of the strictness of EPL and unemployment correlate:

Poorly.
Before going on, maybe I should dwell a little on
Correlation, causation and r squared.
Wikipedia explains to us that: Causation is the relation between an event (the cause) and a second event (the effect), where the second event is understood as a consequence of the first.
About.com says: Two random variables are positively correlated if high values of one are likely to be associated with high values of the other. They are negatively correlated if high values of one are likely to be associated with low values of the other.
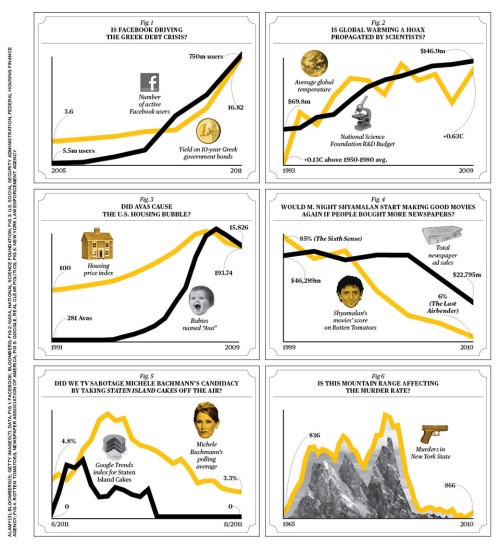
But, remember, correlation does not imply causation:
Wikipedia again: the coefficient of determination, denoted R2 and pronounced R squared, indicates how well data points fit a line or curve. It is a statistic used in the context of statistical models whose main purpose is either the prediction of future outcomes or the testing of hypotheses, on the basis of other related information. It provides a measure of how well observed outcomes are replicated by the model, as the proportion of total variation of outcomes explained by the model.
R squared varies from 0 to 1 and the closer to 1, the better. Not all economists like it, though, as you can read here (one of many experts sharing opinion). When we add variables we should use the adjusted r squared, to compensate for that addition. As more independent variables are added to the regression model, unadjusted R2 will generally increase but there will never be a decrease.
Enough of that.
Time to check other variables, for instance, the incidence of temporary jobs.

Better correlation, but not good enough. What about firing costs? I have taken into account the difference between the severance pay a worker receives after 9 months and after 4 years working, both graded from 0 to 6, being 6 the countries in which a worker gets more money.

This one shows a better correlation, but I wouldn’t say it’s significant. Other possibilities that came to my mind are the following:

Why? I realised that, given that a country only needs, in any given moment in time, a certain amount of working hours to provide for all products and services, if these hours were divided by more people, it would not affect the GDP, but would reduce the unemployment. So the percentage of part-time jobs could be an interesting variable, but the average hours worked per year and person is even better. Consider these situations: a) a country whose full time working hours are 40 per week and with 90 % part-time jobs whose working hours are the 90 % of full time; b) a country whose full time working hours are 35 per week with 33 % part-time jobs whose working days are the 85 % of full time. You would have less unemployment in situation b with a lower share of part-time jobs.

It seems that I was not totally wrong, but this factor alone doesn’t explain the unemployment rates. I also thought of the duration of the unemployment benefits as something that could be discouraging to find a new job and, thus, help to increase the unemployment, but I found out that, apparently, it didn’t.

It’s time to combine them. So I decided to use two of the causes the experts, such as the gap in the firing costs and the variation of construction share in GDP (which is usually negative), and my idea of the average hours per year and person. This is the result:

Pretty good, in my not so humble opinion.
You can’t change the construction industry by law but, what if Spain changes the firing costs and the average hours? Let’s use Germany’s, for instance. The unemployment rate in Spain would be approximately 15 %, and the under 25 rate would be somewhere around 30 %, still high, but within normal.
Then, all Spaniards should do is just establish new types of industry or services. A piece of cake, uh?
Sources:
http://unstats.un.org/unsd/databases.htm
http://epp.eurostat.ec.europa.eu/portal/page/portal/eurostat/home/
And all the above-linked sites..

But before the current crisis unemployment rates in Spain were lower than 10%. And the industries were the same. So there must be more to it than just changing a couple of laws.
Industries were the same, but (big one) there was a housing bubble which meant a lot of unskilled workers in the construction field. And before that, it was high, too. Check that:
The blue line is the unemployment rate, the yellow line is for new house prices, and the green line is inflation.
I find the correlations still rather poor, and the distribution too large for such far-reaching conclusions. Also, even if the statistical correlation is perfect, it says nothing about the casuality.
I think the last correlation is actually good for econometrics, but as you point out (and I have also written in the post), causation and correlation are not the same, so my conclusions may be wrong. The only way to find out would be changing some regulations in Spain and wait for the results or lack of them,
Thanks for reading, anyway.
The bottom line is that if Spain would be Germany, it would have less problems. Spain, though, is not Germany and needs to find Spanish solutions to its problems. Turning Spain and Spaniards into Germans – I don’t think it will succeed or would work.]
I do agree with you that changing work regulations and work attitudes in numerous European countries would certainly help their economy, both macro and on a personal level. Part of the solution, I think, would be if the Spaniards and the Greek would be more like the Poles – that is, using the freedom of movement in Europe and going to where the jobs are.
As a Spaniard myself I agree: Spain is not Germany. And most of my compatriots wouldn’t like it to be. It’s not about changing how people behave or what they like or how they work, it’s just adjusting or copying some labour laws that can actually make a difference. Even if these changes were performed, we would still have a high unemployment rate because of our economic structure. And therefore people in Spain would migrate again, as a lot of us are doing as I write.
[…] […]